System architecture
The page provides an overview on the logic, concepts and key elements of the JRC CbM architecture for all the experts of the Paying Agencies (system administrators, analysts, decision makers, project managers and consultants). The aim is to help understanding the approach and the software solutions proposed and assess and plan its operational implementation. The technical details of JRC CbM are reported in the TECHNICAL DOCUMENTATION and the code is made available in the JRC CbM GitHub space. Here we analyse the requirements of a CbM system and illustrate the solution proposed by the JRC CbM. The goal is to demonstrate the feasibility of the technical implementation of a CbM and that can be used and adapted by MS to create their own system tuned on their specific needs. In the last section (JRC CbM roles), we provide additional information on the different roles in the system.
Scope of the CbM system
The scope of a CbM system is to exploit the time series of Sentinel data to continuously monitoring all the agricultural parcels, i.e. the polygons from the Land Parcel Identification System (LPIS) and the Geospatial Application (GSA) that are associated with a CAP scheme. It generates the minimum required information to confirm/reject compliance with the declared practice and to communicate discrepancies to the farmers in real time, so that they can be amended in due time, if needed.
This process is optimized through automation and reduction of information to handle the data load (i.e. summarize the spatio-temporal image stack of Sentinel into time series of bands statistics per agricultural parcel). The results feed into a traffic light system for follow up: most of the cases will have a definite classification (green: confirmed, red: rejected), while some of them will require further investigation (yellow: inconclusive). This reduces considerably the situations to be verified with other tools (e.g. geotagged photos, higher resolution satellite images, orthophotos, field visits). The same approach can also be used to set up an area monitoring system (AMS), as requested by the new post 2020 CAP regulation (2023-2027).
The main elements of a CbM system are illustrated in Figure 1. This architecture is modular and reflects the general requirements of any CbM system.
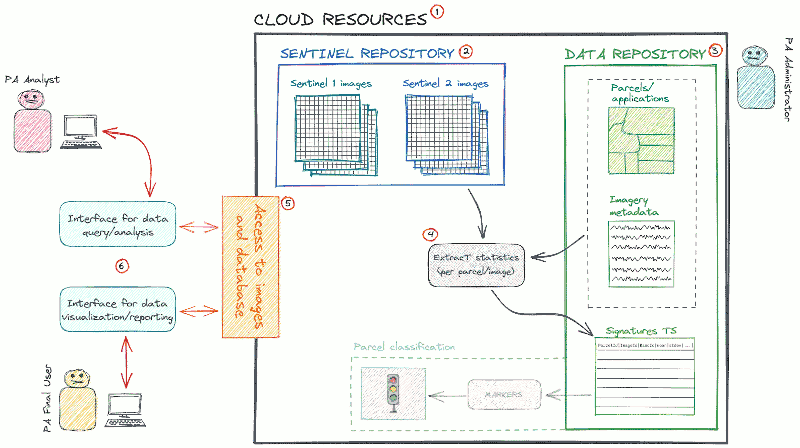
Figure 1. General architecture of a CbM system.
In Figure 2 we show the proposed solution (JRC CbM) for the technical implementation of the general architecture described by Figure 1.
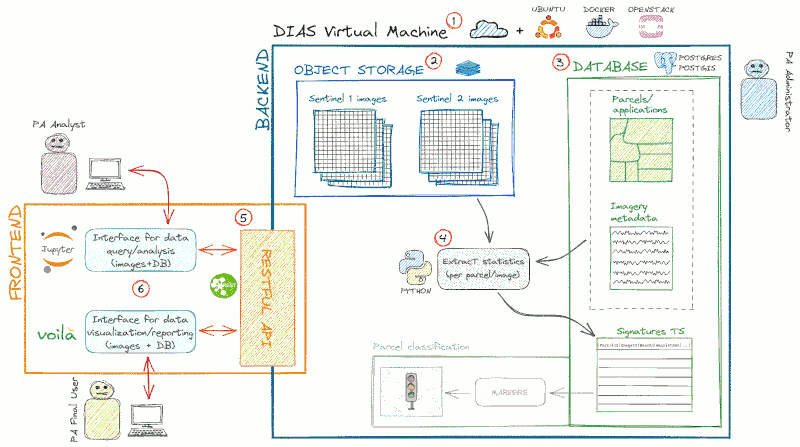
Figure 2. JRC CbM software platform. Satellite data are made available in the Object Storage of the DIAS and processed in that environment by Python modules. The base layers are stored in a spatial database based on PostgreSQL/PostGIS installed in the DIAS server, inside the same environment of the satellite image archive. The server is set up and managed using Ubuntu, Docker and OpenStack. Data access is filtered by a RESTful API that feed the user’s interface, based on Jupiter Notebook and Voilà.
The JRC CbM system is based on two architecture layers: the backend and the frontend (in Figure 2, backend and frontend are identified by the blue and the orange boxes). The backend and the frontend support data analytics. The backend server provides the end-points to retrieve data: it includes the physical infrastructure and the routines that generates the information used by the analysts and the decision makers. It is developed, managed and maintained by a system administrator with expertise in cloud computing and big data analytics. An extended introduction to this layer is illustrated in the BACKEND SYSTEM DEVELOPMENT documentation page. The frontend is the component manipulated by the user: it provides access to the data generated by the backend through standard Application Programming Interface (API). It includes the interfaces and the code for using the data to support typical Paying Agencies functions. Frontend makes data available to analysts without backend expertise. More information are available in the documentation of the FRONTEND. The data generated by and stored in the backend and made available through the frontend is then used by a third layer, data analytics, where the information is used to perform typical CbM tasks (see DATA ANALYTICS documentation page).
In the JRC CbM system the boundary between the backend and the frontend is fluid. Once new procedures are defined and tested by analysts, they can be integrated into the backend and automatically available to users as starting point for additional processing (e.g. analysis, reporting, classification). JRC CbM software modules are all open source and make use of open standards. The code is available in the JRC CbM GitHub repository. The same structure can be operationalized using other software with similar functionalities if the system has to be integrated in an already existing infrastructure. JRC CbM is designed on a cloud-centric basis, but can also be adapted to run stand-alone. The elements of a CbM system and its implementation in the JRC CbM are described below.
Cloud resources: DIAS infrastructure
The huge amount of data (Sentinel-1 and Sentinel-2, parcels) to be stored and the resources needed to process them require an hardware infrastructure that can be hardly set up on a local system. Cloud platforms offer the possibility to optimize the hardware resources according to the specific needs and scale to large data volume without the burden of extensive hardware and software maintenance. In addition, direct access to Sentinel data is needed to avoid downloading the images on a local system. Keeping all the data in the same (cloud-based) container (e.g. images, parcels, statistics) is a further advantage for the efficiency of the CbM process and enforce data consistency and accessibility. Using cloud resources, it is possible to create modular processing pipelines that are tailored to the specific needs of the CbM and the technical capacities of the end users. In the JRC CbM, DIAS are used as cloud infrastructure.
What are DIAS
DIAS are five European core computing and storage infrastructure (CREODIAS, MUNDI, ONDA, SOBLOO, Wekeo) provided as Infrastructures as a Service (IaaS). The actual DIAS use by end users, such as MS Paying Agencies, or any other public or private user, is managed through accounts, i.e. subscription services that are costed on the basis of actual use of computing resources (e.g. CPU time, data transfer, additional storage requirements). DIAS fit current and future CbM system needs. In addition to the typical features of cloud infrastructures (e.g. configurable compute resources that can scale to needs and possibility to run parallel tasks when tasks can be parallelized, which is the case for CbM), they grant access to a consistent, complete Sentinel data archive and provision of on-demand standard CARD processing. They are based on open industry standards and built up with core open source modules. DIAS may be used at increasing levels of complexity, e.g. (1) simple CARD downloads, (2) extracting reductions to (3) full data analytics.
More information on DIAS setup and configuration are reported in the technical documentation pages.
DIAS Virtual Machines
The DIAS Virtual Machines (VMs) are managed using Linux as operating system (Ubuntu). Linux bash scripting is used for orchestration and parsing. Reprojection and other basic spatial processing are based on the GDAL library. The DIAS tenant can select and configure VMs for specific functions: permanent VMs (e.g. data base server, Jupyter Hub, RESTful) and transient VMs (use on demand, run large tasks in parallel, tear down).
As a first step, we use Openstack resources “marshalling”. OpenStack is a free, open standard cloud computing platform. It is deployed as infrastructure as a service where virtual servers and other resources are made available to users. It scales horizontally and is designed to scale on hardware without specific requirements.
In a second step, we “orchestrate” the resources to execute parallel tasks (for example parcel and chip extraction). We use Docker containerization to ease cross-VM installation. Docker is an open platform for developing, shipping, and running applications. It uses OS-level virtualization to deliver software in packages called containers. Containers are isolated from one another and bundle their own software, libraries and configuration files. They can communicate with each other through well-defined channels. Docker enables to separate applications from the infrastructure so that the infrastructure can be managed in the same ways you manage the applications. Docker containers behave like specialized VMs. We use Docker Swarm as container orchestration tool, meaning that it allows us to manage multiple containers deployed across multiple host machines. Figure 3 shows the Copernicus DIAS IaaS architecture.
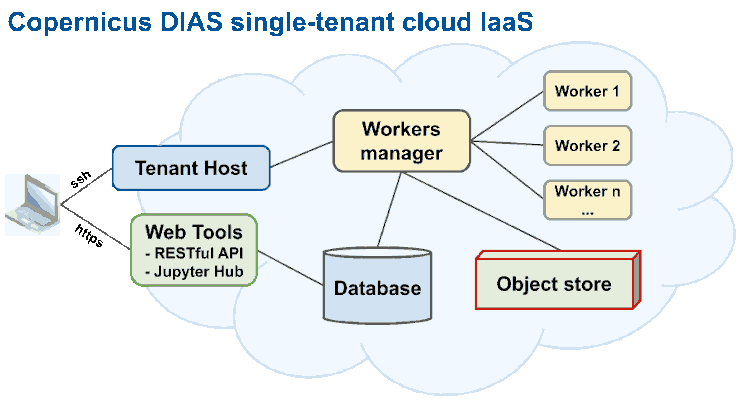
Figure 3. Copernicus DIAS Infrastructures as a Service.
Sentinel data access: DIAS object storage
Sentinel-1 and Sentinel-2 data are at the heart of the system. The information must be accessible in near real time and for all the agricultural areas under assessment. The huge amount of data, tens of petabytes (i.e. ten million gigabytes), requires dedicated and performant tools for storage and access, being a old-fashion flat-file based approach inefficient and not practical in this context. Sentinel imageries should be available to end users as Application (or Analysis) Ready Data (ARD), i.e. in a format that is ready for analysis so that users can work with the images without the burden of complex and time consuming pre-processing steps. Copernicus ARD (CARD) should, as a minimum, include georeferenced, calibrated sensor data (Level 2). The DIAS object storage made available the Copernicus data in an efficient way.
What is DIAS object storage
The best tool to store and manage immutable “Big Data” blobs that are write once and then read often (e.g. YouTube video, DIAS Sentinel data) is object storage. Object storage (also known as object-based storage) is a data storage architecture that manages data as objects, as opposed to other storage architectures like file systems which manages data as a file hierarchy, and block storage which manages data as blocks within sectors and tracks. Each object typically includes the data itself, a variable amount of metadata, and a globally unique identifier. It is simpler to manage and extend than file or block storage, and it is much cheaper. The access is generally slower, especially since it is not optimized for partial reads. It requires API to transfer to classical file system to be handle as normal file. CREODIAS, MUNDI, SOBLOO and Wekeo all use S3 (AWS, GCS standard) object storage. ONDA uses ENS (OpenStack Swift). Object storages can manage tens of Petabytes data (e.g. CREODIAS ~ 20 PB, Goggle Earth Engine ~ 85 PB). In JRC CbM, DIAS object storage is accessed through the Python library Boto3.
Copernicus ARD generation
DIAS instances offer a Processing as a Service (PaaS) solution for generating Copernicus Application Ready Data (ARD). ARD is stored in the S3 object store of the DIAS, in public or private buckets. Sentinel-1 and Sentinel-2 data are, by default, delivered by ESA through the Copernicus Hub as Level 1 data. Level 2 (atmospherically corrected) Sentinel-2 data is also made available. For Sentinel-1, this is not the case (an anomaly that may be resolved in the future). Sentinel-1 ARD processing is done by JRC CbM backend to generate calibrated geocoded backscattering coefficients from Level 1 GRD (CARD-BS) and geocoded coherence from Level 1 SLC S1A and S1B pairs (CARD-COH6). If ARD does not already exist in DIAS archive for a given country, it has to be generated by the system. After a bulk generation of ARD is done until the last available date, a backend batch process will ingest (with a typical delay of 1-2 days) the new images that are made available in the ESA hub and transferred to the DIAS. ARD generation process is not yet part of JRC CbM documentation, but it is available on request. More information on JRC CbM CARD data are reported in the technical documentation pages.
Data repository - PostgreSQL/PostGIS
In addition to Sentinel images, the system has to manage and process other control data sets in order to check farmers’ declaration. The first one is the agricultural parcels: polygons from the Land Parcel Identification System (LPIS) and Geospatial Application (GSA) that are associated with a CAP scheme, managed by the PA. It is a spatial layer with associated non-spatial attributes. The number of polygons can be in the order of hundreds of thousands. The second layer is the metadata of Sentinel images. This data set is derived from the Sentinel archive and includes the key information of each image (e.g. id, date, extent) and make images retrieval and identification faster. Finally, the system has to store the signatures (or statistics) of Sentinel bands extracted per polygon (also called reduction in the context of JRC CbM).
The spatial nature of these data sets, their well defined relations, their size and the need for scalability (signature data set increase quickly over time), the importance of data consistency and the need to make the data available to multiple tools and users point to spatial relational databases (SRDBMS) as the state of art technical solution.
In an operational national CbM system, a relational database can be used not only to support extraction and management of signatures data, but is also a good candidate as central repository for all the information relevant for the CAP process. In such a context, the technical solution depends on the specific goals and constraints of each Paying Agency (parcel classification according to the traffic light sysyem is included in Figure 1 with transparency as it is just an option for an extension of the CbM). In the JRC CbM solution, the proposed software for data repository is the open-source Relational DataBase Management System (RDBMS) PostgreSQL with its spatial extension PostGIS. They represent the state of art SRDBMS, which can efficiently manage very large spatial (and temporal) and non spatial datasets with a complex structure in a multi-user and secure environment.
In JRC CbM, Sentinel metadata are parsed into PostgreSQL/PostGIS dias_catalogue table, while data on parcels are ingested by the users. Signature data are generated by the JRC CbM backend processing. JRC CbM architecture integrates the database into the DIAS server, in the same environment of the object storage that manage Sentinel data, but it can also be deployed on a local server. The information about the database content, structure, description, connection, management and how to retrieve data is provided in the technical documentation pages.
Extraction of statistics - Python processing
The key information to assess compliance of a declared practice is the time series of statistics (mean, max, min, median, 25 quantile, 75 quantile, standard deviation, number of pixels), also called signatures, of Sentinel bands for each polygon. It is generated by a spatial intersection between the Sentinel-1 and Sentinel-2 bands and the polygons from the Land Parcel Identification System (LPIS) and Geospatial Application (GSA). The most relevant bands for CbM are Sentinel-2 B02, B03, B04, B08, B5, B11 and Sentinel-1 VV, VH. Sentinel-2 scene classification map (SCL) is also important to identify (and ignore) images where the signal is affected by clouds. The image is selected using the image metadata of the Sentinel archive. The availability of Sentinel CARD ensures that the spectral and temporal information (i.e. time series) can be extracted consistently. Although it is technically feasible to generate a CARD time series on demand, it is often convenient to extract large sets of parcels, for pre-selected bands, in a batch process. Cloud infrastructures, and particularly DIAS, are specifically tailored to these kind of tasks, since extraction is typically a massively parallel processing step that can benefit from the use of multiple machines. Since CbM covers 100% of the territory, it needs to be supported by smart analytics that filter out the anomalies quickly and consistently. The signal statistics can be used in such analytics, e.g. to support outlier identification, detection of heterogeneity, marker generation. The extraction has to be an automated and performant process given the amount of elements to be calculated. To give an order of magnitude, if the parcels are 500,000, the Sentinel-2 images are 73 (an image every 5 days in a single year) and the bands are 8, the number of signature records generated is about 300 millions. Other ancillary data may be required to explain signal artefacts (DEM, weather parameters, etc) and the system should be able to manage them as well.
In the JRC CbM, the backend processing of Sentinel data extraction to reduce the spatio-temporal image stacks of ARD to parcel time series is based on Python, a general-purpose programming language with simple syntax and code readability that make coding easy and efficient. It has a large set of specific libraries, particularly for data science.
Extraction is set up as an automated process that:
finds the oldest image that is not yet processed
transfers the image bands from the S3 store onto local disk
queries the database for all parcels within the image bounds
extracts the statistics (μ, σ, min, max, p25, p50, p75) for the bands of the image
stores the results in the time series database table
clears the local disk
In the JRC CbM, Python is used not only for data extraction but is the syntactic glue of the whole system, especially in the frontend. The numpy, pandas, geopandas, rasterio, and osgeo packages are widely used in many of the system modules. The psycopg2 library is used to connect with the database and retrieve and manipulate the data. In a complete CbM system, the backend can also use Python to detect agricultural practices linked to farmer’s declaration processing. The output then should feed into traffic light system for follow up (e.g. the need for complementary information).
In principle, there is no reason why parcel extraction could not be offered as a PaaS, and this might be an option for the future, simplifying CbM systems.
Data access - RESTful API
Analysts need to access the data generated by the backend (i.e. CARD data, if not already in DIAS archive, and parcel time series of Sentinel spatio-temporal image stacks) to feed into post-processing. While direct access to tables, spatial features and images stored and managed in the cloud infrastructure is possible with a DIAS account and recommended for developers/analysts that can retrieve and visualize data with specific tools (e.g. Python Jupiter Notebooks and database clients like PgAdmin or QGIS), it exposes the system to multiple issues. First of all, it requires advanced technical skills that analysts and decision makers do not always have in their background (for example SQL, the database language). Then, directly open the system to many users exposes it to potential security risks. Finally, inexperienced users could try to run processing that is not optimized and thus consuming abnormal resources. An intermediate layer that offers pre-defined functionalities and formats to consume data from the backend, for example the time series of statistics and images for a user-defined parcel, can help to address these problems. The final users can use this intermediate layer that provide predefined functionalities to extract data based on a limited and controlled set of parameters. This ensures performance and security by preventing poorly designed resource-intensive image retrieval and database queries and facilitates access to basic users with no knowledge of tools for data extraction (e.g. SQL) as it can serve standard queries and abstracts more complex tasks. Analytical algorithms and markers are designed and tested in the analytical layer that gets data through the frontend, but when methods are consolidated the system should allow their implementation in the backend.
In the JRC CbM system, analysts access the backend data sets though a RESTful API. A RESTful API is an application programming interface (API) that conforms to the constraints of REST architectural style. An API is a set of definitions and protocols for communicating what you want to that system so it can understand and fulfil the request (sse Figure 4). REST stands for representational state transfer. It is an architectural style for distributed hypermedia systems: it defines a set of constraints for how the architecture of an Internet-scale distributed hypermedia system should behave. An essential character of the RESTful services is that they follow standard calling conventions, which allow their use both in interactive testing and scriptable machine access. RESTful services are further described in the technical documentation pages.
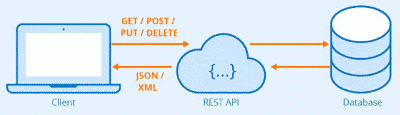
Figure 4. Schema of the interaction between users and the database through the RESTful API.
In the JRC CbM system, the RESTful API provides abstracted access to database tables, to sub-selections of S3 stored CARD data and to advanced server-side processing routines. Examples of RESTful requests in JRC CbM are:
basic information retrieval on parcels (parcelByLocation)
parcel time series statistics (parcelTimeSeries, parcelPeers) [fast]
image chip selection, for visualization (chipByLocation, backgroundByLocation (Google, Bing and orthophotos via WMTS)) [slow]
image chip selection, full resolution GeoTIFFs (rawChipByLocation, rawChipsBatch, rawS1ChipsBatch)
RESTful can be integrated in scripts, automated reports, and Jupyter notebooks via Python requests.
Another option for accessing data is the use of a Jupyter Hub server configured to hide the intrinsic access protocols and supporting interactive scripting and data visualization. A mixture of direct access and RESTful services is also possible, for example with a Jupyter notebook running on the Jupyter Hub that uses both.
Finally, an alternative use pattern would be to transfer the time series database to a dedicated server set up outside the DIAS cloud infrastructure, for instance, into the PA’s ICT infrastructure. RESTful services running on DIAS can then be used to maintain access to the DIAS CARD data store to support on demand generation of image fragments, for instance.
Interfaces for data use - Jupiter Notebooks
In addition to the intermediate layer to access the CbM data, the data analytics layer requires automated tools and interactive interfaces to classify, visualize and post-process the information generated by the system. These interfaces must be coherent with their technical skills and goals. Analysts should be able to interact with data using the most common geospatial processing languages and libraries, while final users need visual output that can be interpreted (e.g. graphs, images, reports) and tools to support the compliance verification procedure. Users can access data directly or through the RESTful API. In both cases, they need an interface to visualize (as graphs, maps, tables) and analyse (applying for example statistical algorithms, machine learning) data according to their needs. In The JRC CbM system, the main tool used for this task is Jupyter Notebooks. Jupyter Notebooks are documents that contain live code (particularly Python), equations, graphics and narrative text. The open-source interface offers a web-based interactive computational environment for, among the others, data cleaning and transformation, numerical simulation, statistical modelling, data visualization, and machine learning. Python is used to get, process and display the data. In particular, analysts are interested in the identification of markers. Markers are sequence of signatures (statistics derived from Sentinel bands for each parcels) that can be associated to the agricultural practices declared by the farmer according to CAP schemes (when Sentinel data can pick up the signature of the events and patterns that relate to the practice). Jupiter Notebooks offer an ideal environment to explore and test new markers and analytical approaches. Once established by analysts and consolidated, markers can be integrated in the backend and used to confirm/reject compliance with the declared practice, feeding into traffic light system for follow up (e.g. the need for complementary information) by decision makers. In the JRC CbM a flexible marker detection framework has been developed to facilitate the data analytics.
JRC CbM roles
JRC CbM considers roles. Not all roles need to work with all modules. The are thee main classes of roles:
ICT experts create and maintain the infrastructures with its required server components, e.g. monitoring CARD production, run extractions. This backend role can be managed by one person per MS (or even DIAS).
Data analytics experts program and run core analytics (e.g. extraction, machine learning, development of markers). They can be both internal and external to the PA.
Data consumers extract, cross-check, verify, combine, decide and report.